Ideas & Deviations
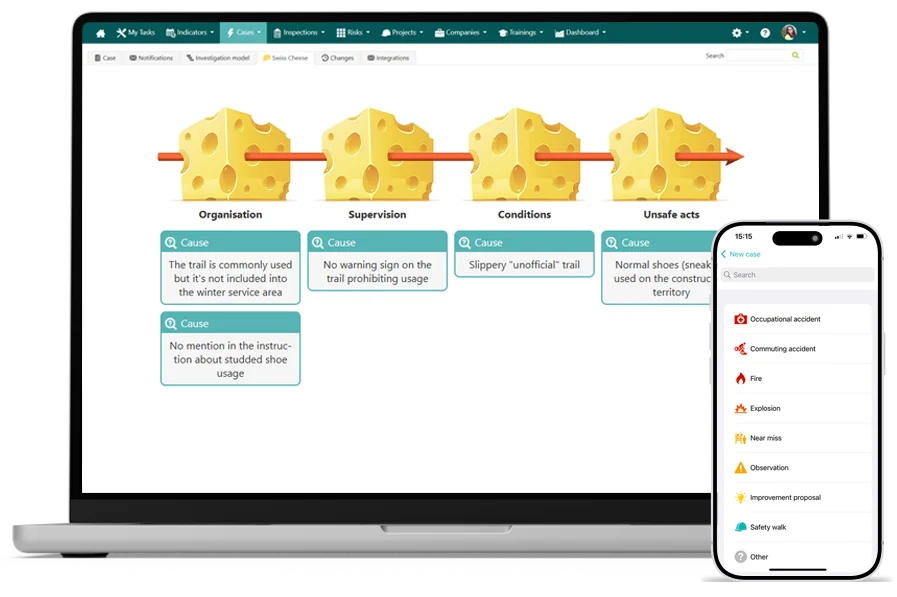
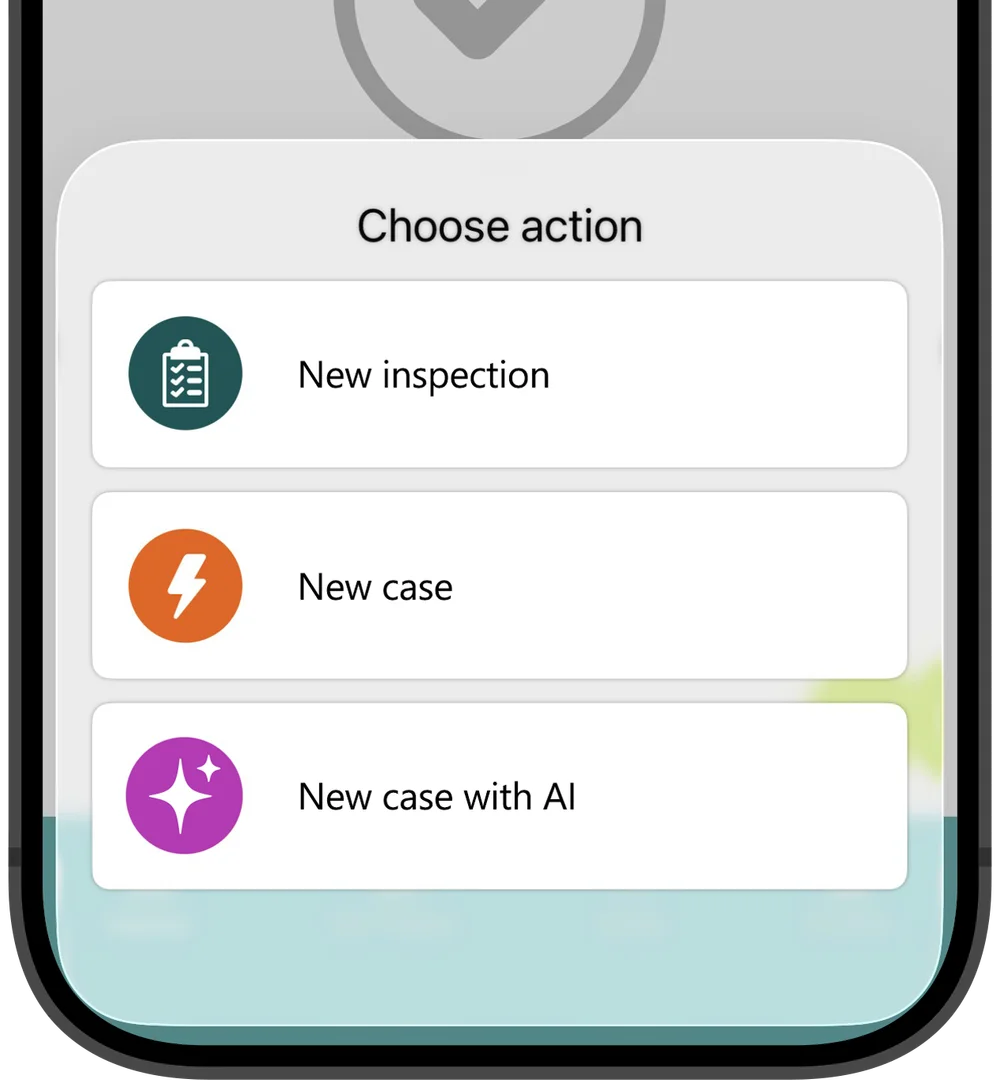
Make it easy for everyone to report incidents, near misses, observations and ideas - without training.
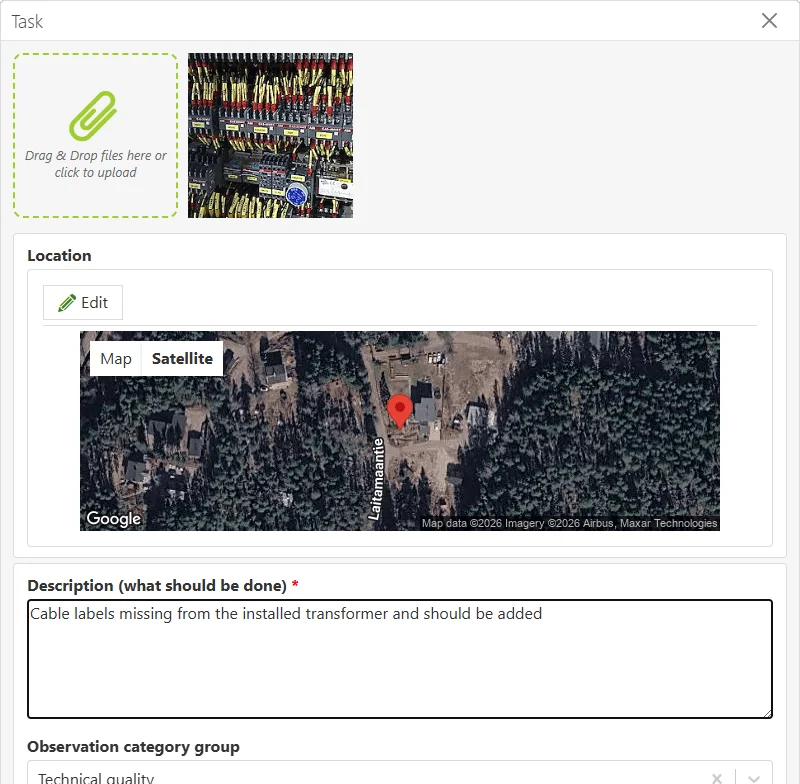
Report using native mobile apps for iOS and Android with offline support for challenging locations and AI assist for voice input.
Promote safety at sites, factory floors and offices by placing QR codes with a direct link to safety reporting.
Configurable email and text message notifications to stakeholders: from informing team members about ideas to notifying top management about accidents.
Quickly route every case to the right person with built-in logic and automation.
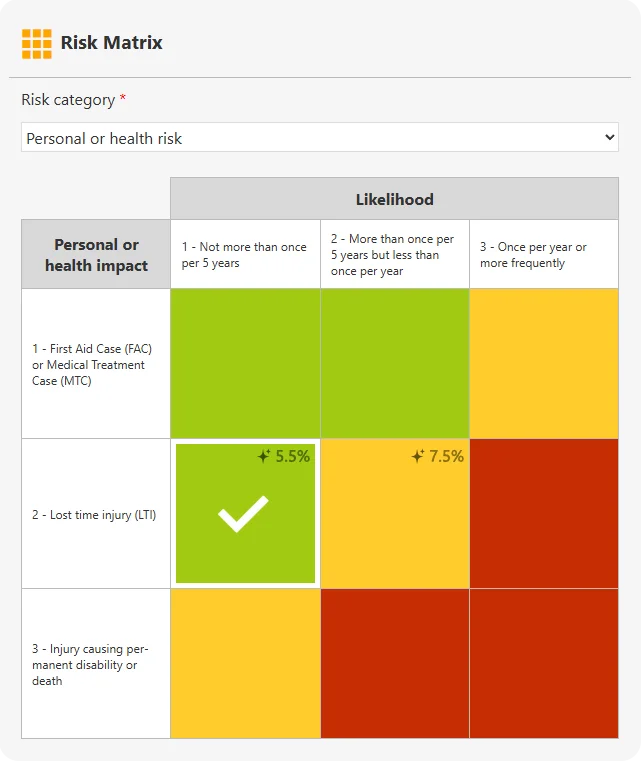
The classification performed for each deviation provides data for analytics and defines how seriously should the deviation be handled further.
AI assistant helps to choose correct classification options based on the historical data such as suggesting correct occurrence probability and potential impact.
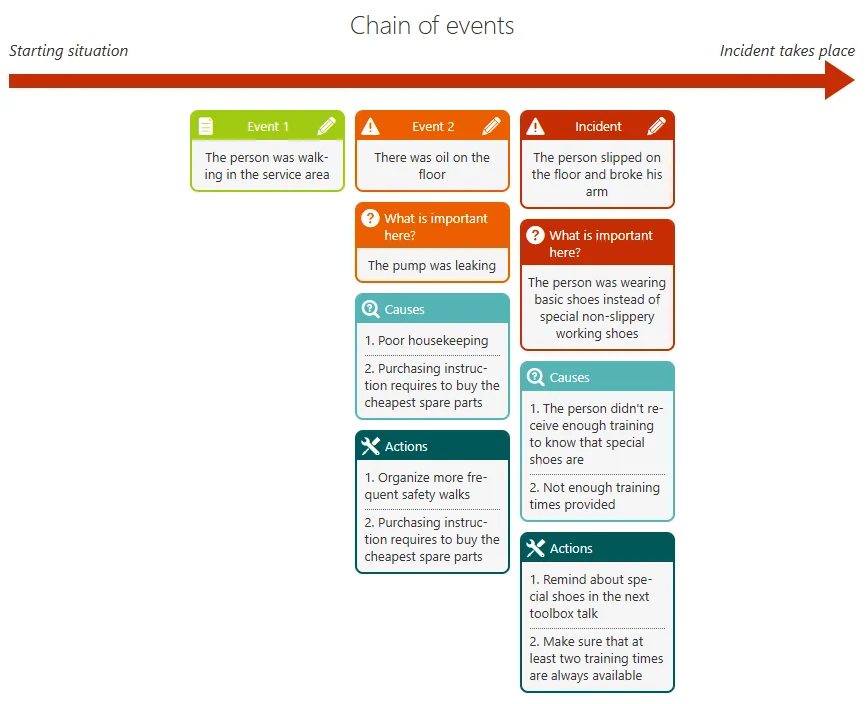
Serious and frequently occurring deviations require digging deep. Our built-in interactive models such as "Chain of events", "Five whys", "Swiss cheese" and "Fishbone" help to identify not only immediate but also root causes and prevent incidents from repeating.
The models are easy to use so there is no need to be a professional investigator to get to the bottom of the issues.
Root causes are summarized in dashboards providing an insight into weak areas which require improvements.
Corrective and preventive actions identified during the investigation could be assigned to both employees or contractors and implemented directly with mobile apps.
The implementation is automatically followed up with regular reminders.
Via an integration actions could also be sent for implementation to external systems and automatically kept up-to-date.
It is crucial to make sure that if a problem is identified and fixed in one part of the organization, it does not repeat in others. Automatically generated safety bulletins help to share the learnings and boost collaboration.
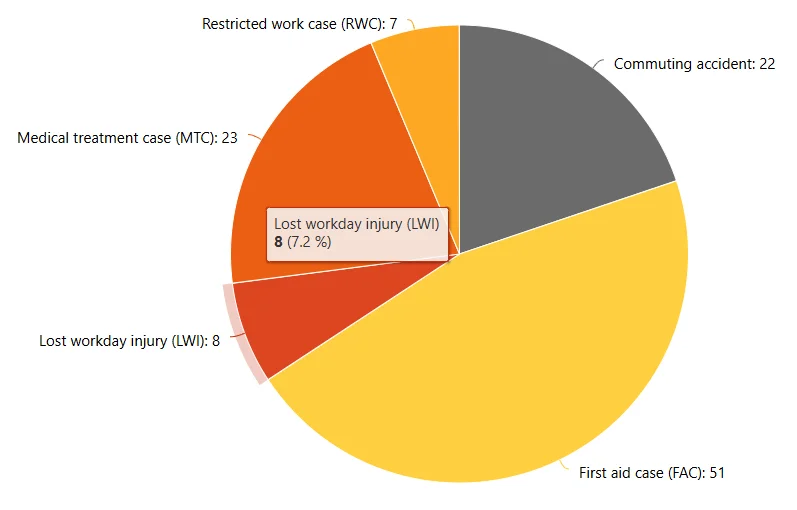
Built-in personalized dashboards help to see the big picture to spot trends across the organization and improve processes based on the data.
The dashboards allow to see both "the forest" and "the trees" supporting drilling down from stats to individual cases.
All the visuals support using own brand colors so users would be able to directly use them in company materials.